Bo Bikes Bama – Bo Jackson Explains [video]

On April 24-28, 2012, sports legend Bo Jackson will bike 300 miles through the tornado ravaged communities of Alabama. Bo is riding his bike to raise $1 million for the Governor’s Emergency Relief Fund, which was established to help Alabamians with unmet recovery needs that unfolded in the wake of the deadly tornado outbreak across the state in April 2011.

“The reason for this ride is for state unity and to pay homage to the great Alabamians who lost their lives on April 27th, 2011. I am my brothers’ and sisters’ keeper.
-Bo Jackson, Heisman trophy winner, All-Star athlete and proud Alabamian

https://www.BoBikesBama.com

Assessment of Driver Yield Rates Pre- and Post-RRFB Installation in Bend, Oregon

by Oregon Department of Transportation, via walkinginfo.org

Rectangular Rapid Flashing Beacons (RRFB)

Driver yielding rates increased significantly at all three intersections where RRFBs were installed. Prior to the installation of RRFBs, data was collected on a total of 159 crossings at the three intersections; following RRFB installation data was collected on a total of 211 crossings. The average yielding rate was 17.8%; following installation the average yielding rate more than tripled to 79.9%.

Continue reading “Assessment of Driver Yield Rates Pre- and Post-RRFB Installation in Bend, Oregon”

Health Economic Assessment Tool (HEAT)

by World Health Organization (WHO), via walkinginfo.org

This tool is designed to help you conduct an economic assessment of the health benefits of walking or cycling by estimating the value of reduced mortality that results from specified amounts of walking or cycling.

The tool can be used in a number of different situations, for example:

  • when planning a new piece of cycling or walking infrastructure.HEAT attaches a value to the estimated level of cycling or walking when the new infrastructure is in place. This can be compared to the costs of implementing different interventions to produce a benefit-cost ratio (and help to make the case for investment)
  • to value the reduced mortality from past and/or current levels of cycling or walking, such as to a specific workplace, across a city or in a country. It can also be used to illustrate economic consequences from a potential future change in levels of cycling or walking.
  • to provide input into more comprehensive economic appraisal exercises, or prospective health impact assessments. For example, to estimate the mortality benefits from achieving targets to increase cycling or walking, or from the results of an intervention project.

Continue reading “Health Economic Assessment Tool (HEAT)”

Spotlight on Pedestrian Safety

[B’ Spokes: Have you noticed how few places in Maryland have high-visibility crosswalks? There is a reason why we have the forth highest pedestrian fatality rate. Those that were worse are making improvements mentioned in this article.]


by Tamara Redmon, Dan Gelinne, Leah Walton, and Jeff Miller, FHWA

FHWA’s aggressive approach to reducing the fatality rate in
13 States and 5 municipalities is showing promising results.

Focus cities have installed high-visibility crosswalks, such as this one in Montclair, NJ, in a number of locations to improve pedestrian safety.
Focus cities have installed high-visibility crosswalks, such as this one in Montclair, NJ, in a number of locations to improve
pedestrian safety.

For the past 7.5 years, the Federal Highway Administration
(FHWA) has been trying to aggressively reduce pedestrian deaths by focusing
extra resources on the States and cities with the highest numbers or rates of
pedestrian fatalities. In recent years, 13 States experienced pedestrian
fatalities above 150 per year and above the national rate of 2.5 per 100,000
population. In 2003 those States were Arizona, California, Florida, Georgia,
Hawaii, Illinois, Michigan, New Jersey, New Mexico, New York, North Carolina,
Pennsylvania, and Texas. An increase in Nevada’s rate later added it to the
list, while Michigan dropped off in 2007. In addition, five cities had the
highest number of fatalities per year: Chicago, IL; Detroit, MI; Los Angeles,
CA; New York, NY; and Phoenix, AZ. Washington, DC, later went on the list, and
Detroit dropped off (only to rejoin in 2011).

To address this challenge,
FHWA’s Focused Approach to Pedestrian Safety project began with a memorandum
dated May 2004 outlining the goal of reducing pedestrian fatalities by 10
percent by the year 2008 (goal later changed to 2011).


Continue reading “Spotlight on Pedestrian Safety”

Going on a Road Diet

[B’ Spokes: This has relevance to Baltimore and it’s resistance to Road Diets.


by Carol H. Tan, FHWA

Lane
reduction can increase safety for pedestrians, bicyclists, and motorists while
improving the quality of life in downtowns across the country.

(Before) A road diet conversion helped turn this five-lane Main Street in Pottstown, PA, into a more livable downtown with facilities for motorists and other users.
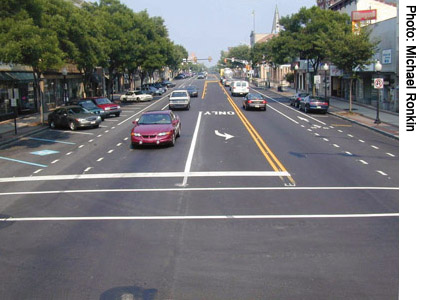
(After) Pottstown’s Main Street after repaving and implementation of a road diet now has travel and bicycle lanes, a center left-turn lane, and parallel parking on one side changed to back-in diagonal parking. Increasing parking can help local businesses attract shoppers.

Benefits

In theory, road diets have potential drawbacks, but in fact,
case studies in a number of States suggest that problems usually do not occur.
Instead, this approach offers a number of benefits in terms of traffic
operations, safety, and livability when applied in the appropriate situations.

Lagerwey says, “In general, when you complete a road diet, you can expect close to a 30 percent overall crash reduction factor. There are at least 50 to 60 standard traffic operation tools that we have to reduce crashes. Getting close to a 30 percent crash reduction factor is a really high number in terms of the effectiveness of a particular treatment.”

Public Acceptance

Gaining public acceptance is important but can be challenging.
Without the support of the residents and business owners, the road diet may not
happen or, if it is installed, residents may criticize the transportation
department’s efforts. Common concerns include impact on traffic flow,
congestion, cost, increased traffic on neighborhood streets, and access to and
from driveways and side streets.

A transportation agency can address concerns about traffic flow and congestion by providing the results of success stories where road diets improved mobility for all road users. When road diets are applied appropriately, traffic will remain relatively unchanged. Lagerwey offers a word of caution, however: “Pay attention to the signalization to avoid potential backups. See if you need to put in a left-turn arrow so your road diet doesn’t backfire. The public reaction will be that there is a problem — not with the signal, but with the road diet — and they will want to get rid of it.”

https://www.fhwa.dot.gov/publications/publicroads/11septoct/05.cfm

What is Bicycle Travel? – PathLessPedaled.com [video]

[B’ Spokes: While this video is about bicycle touring and a great adventure can be had on Maryland’s own C&O Canal. But any travel by bicycle can have such rewards. I was showing someone a bike route to downtown via Clipper Mill Rd, it was just like this video. Heading north on the NCR Trail and discovering ice cream in New Freedom, PA, was just like what is shown in the video. There is a wonderful world out there, get out and enjoy it!]


What is Bicycle Travel? – PathLessPedaled.com from Russ Roca on Vimeo.